Air times have held steady for decades. Scheduled block times keep growing.
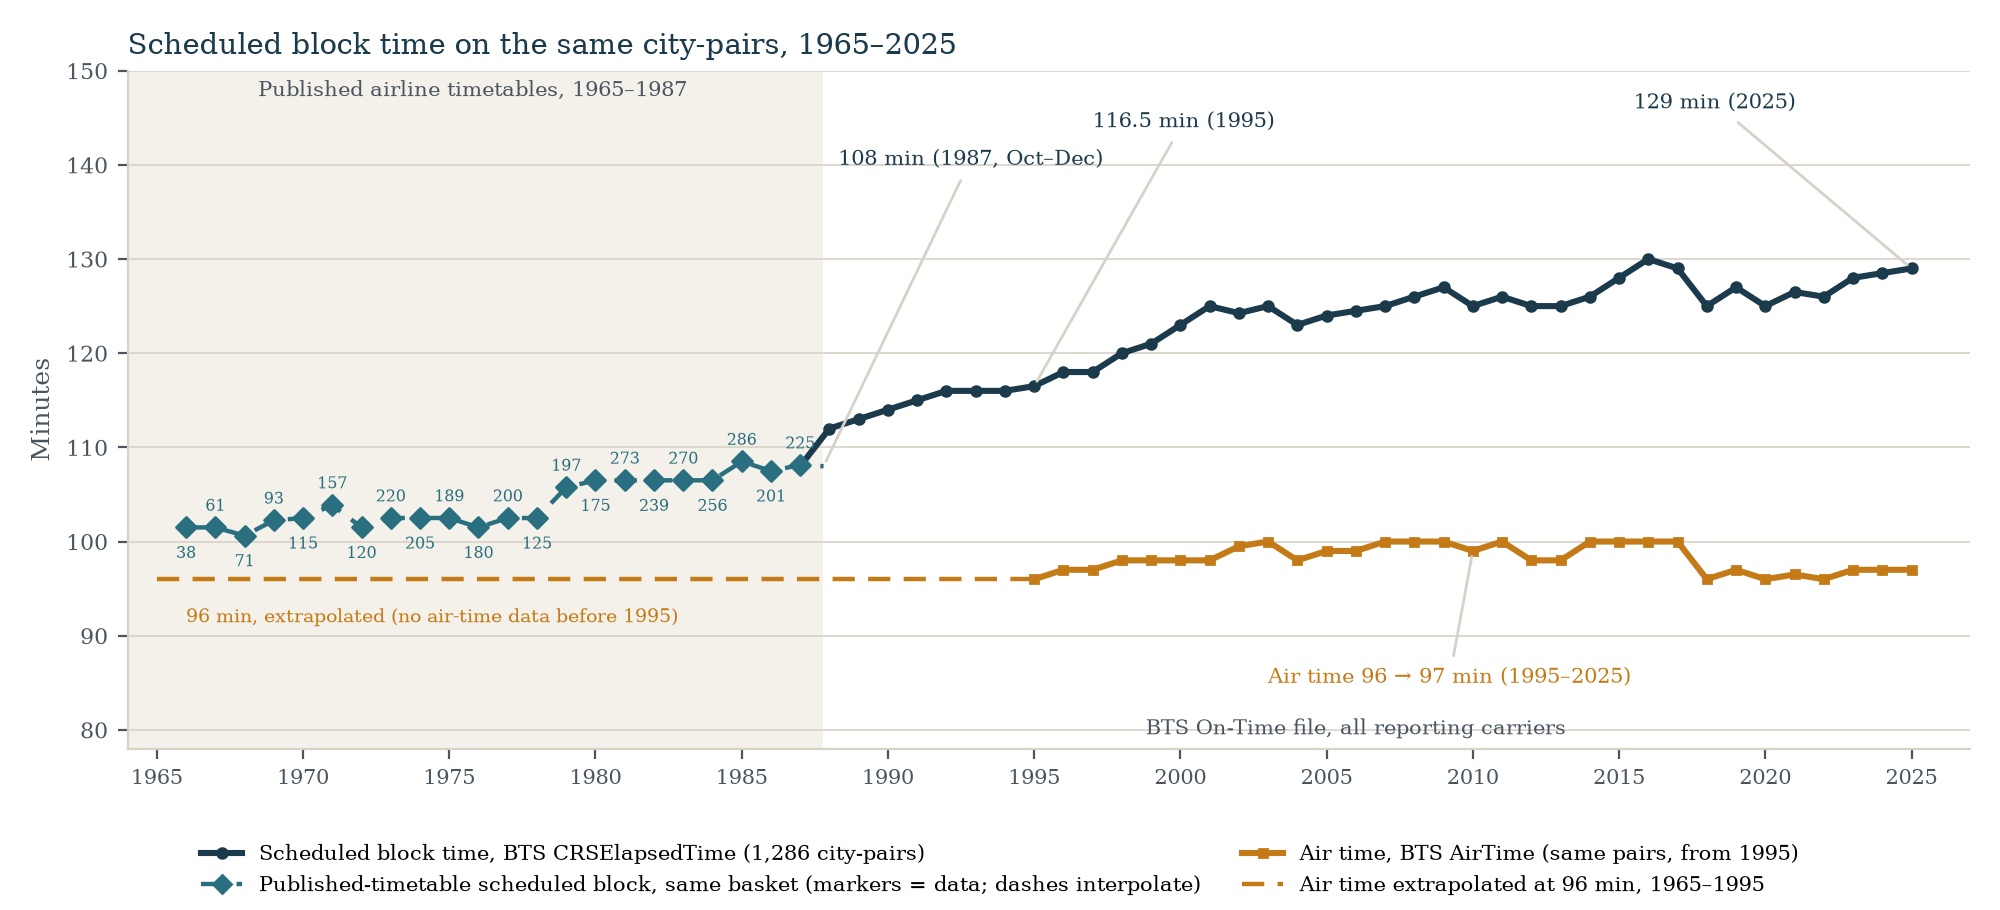
On the same 1,286 city-pairs, median air time moved from 96 to 97 minutes between 1995 and 2025, while scheduled block rose from about 100.5–104 minutes in 1966–1978 to 116.5 minutes by 1995 and 129 minutes in 2025.
Check your route
Pick an origin and destination, or search a city-pair, to see that route’s scheduled block and air time from the earliest year with data through 2025. City-pairs are undirected: LGA–ORD is the same as ORD–LGA.
Enter two airport codes to load the history.
Source: BTS On-Time Performance, all months. Scheduled block is CRSElapsedTime (the airline’s computer-reservation-system scheduled gate-to-gate time). Actual air time is AirTime (wheels-off to wheels-on). Pre-1987 points are published airline timetable schedule, not BTS data, and are blank when no usable timetable flights were read for that pair and year. Air time is blank before 1995 because the field is not populated in the BTS file. A BTS year is shown only if the pair had at least 30 flights that year. Years with no observation are left as gaps; values are not estimated or interpolated. 1987 BTS figures are October–December only. 2026 is not used as an endpoint.
Top 50 busiest routes in 2025
The 50 undirected city-pairs with the most BTS-reported flights in 2025. “Scheduled block then” is the median scheduled block in the earliest year that pair has data — a published timetable schedule if one was read for the pair before the BTS file begins, otherwise BTS CRSElapsedTime. Air time begins in 1995; n/a means that year has no usable figure (the pair was not flown enough in 1995, or AirTime is missing). Change is 2025 scheduled block minus the earliest scheduled block, in minutes.
| City-pair | 2025 flights | Earliest year | Scheduled block then | 2025 scheduled block | Change | Air time 1995 | Air time 2025 |
|---|
Headline findings
These findings rest on about 226 million flights with a usable scheduled block time from 1987 to 2025, including about 179 million flights on 1,286 city-pairs flown in both 1995 and 2025. Before the BTS file begins, 121,030 nonstop flights from 321 published airline timetables (22 airlines, 1965–1987) extend the record to the mid-1960s. Block time here means the scheduled gate-to-gate time, departure to arrival, that the airline publishes. The FAA ASPM cross-check is a separate, smaller sample and is not included in those totals.
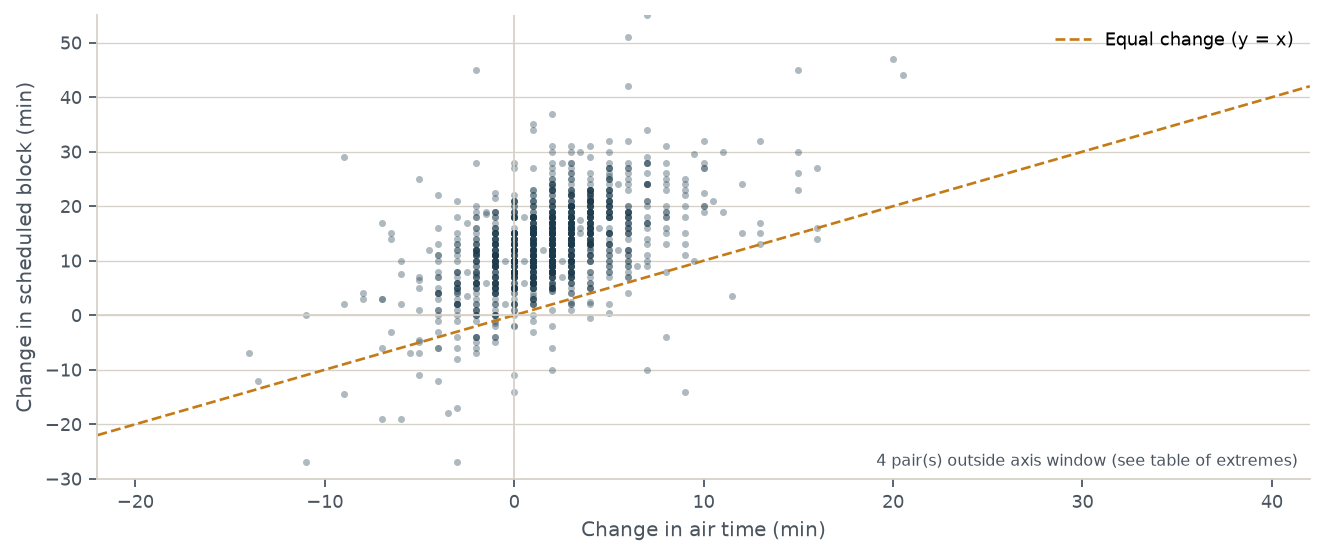
- On 1,286 airport pairs flown in both 1995 and 2025 (at least 30 flights each year), the median change in median scheduled block was +13 minutes. The median change in median air time on those same pairs was +2 minutes. Scheduled block grew more than air time on 1,225 of 1,286 pairs (95.3 percent).
- Treating those same 1,286 city-pairs as a constant basket, the median of their route-level median scheduled blocks rose from 116.5 minutes in 1995 to 129 minutes in 2025. The median of their route-level median air times moved from 96 to 97 minutes.
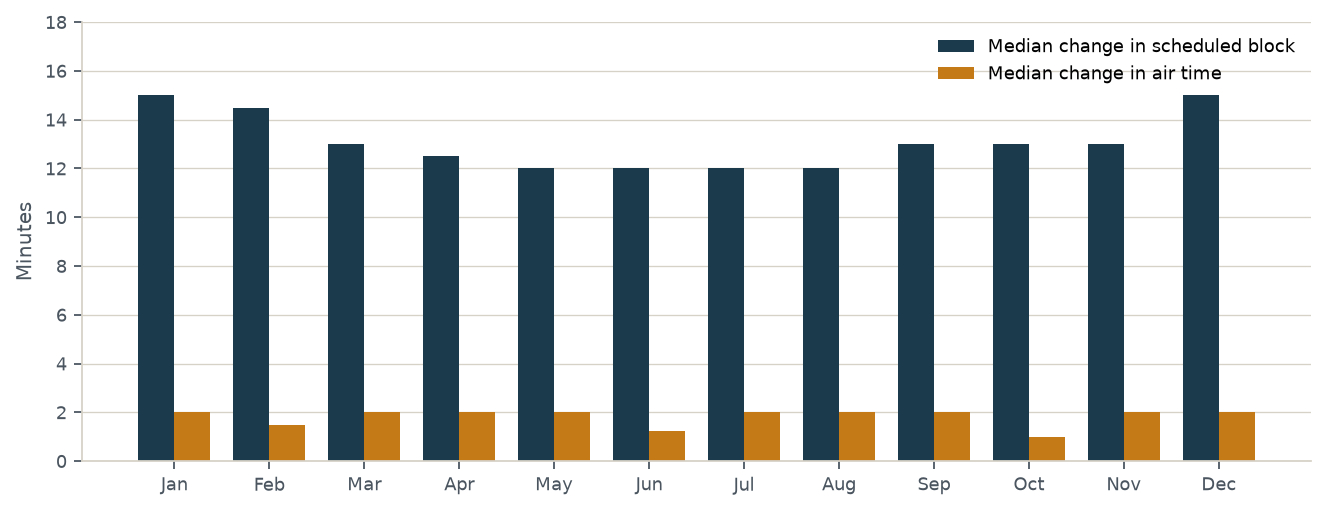
- Every calendar month shows the same pattern: the median scheduled-block change from 1995 to 2025 is between +12 and +15 minutes, and the median air-time change is between +1 and +2 minutes. October (+13 scheduled, +1 air) was not an outlier.
- Among the 50 busiest continuing city-pairs, scheduled block grew more than air time on every pair (median scheduled growth +14.2% against +2.6% for air time). LAS–LAX scheduled block went from 60 to 78 minutes (+30.0%) while air time went from 42 to 43 (+2.4%).
- Published block on routes that still exist was already shorter in 1960s and 1970s timetables than in today’s BTS files. LGA–ORD sat at 112 to 127 minutes in 1969–1972 timetables, 130 minutes in 1995, and 151 minutes in 2025, while air time went from 102 to 107. BOS–LGA was 50 minutes in 1969 and 1972 shuttle timetables and 83 scheduled / 43 air in 2025.
- Published timetables show block times were shorter before the BTS era. On the same basket city-pairs, timetable scheduled block time sits at about 100.5–104 minutes (basket-equivalent) in every year from 1966 to 1978, rises to 105.75–106.5 minutes in 1979–1984 and 107.5–108.5 minutes in 1985–1987, and meets the BTS value of 108 minutes in October–December 1987 without a jump (the January–September 1987 timetables give 108.1). Delta Air Lines supplies 81 percent of timetable flights; the other 21 airlines, computed separately, show the same pattern.
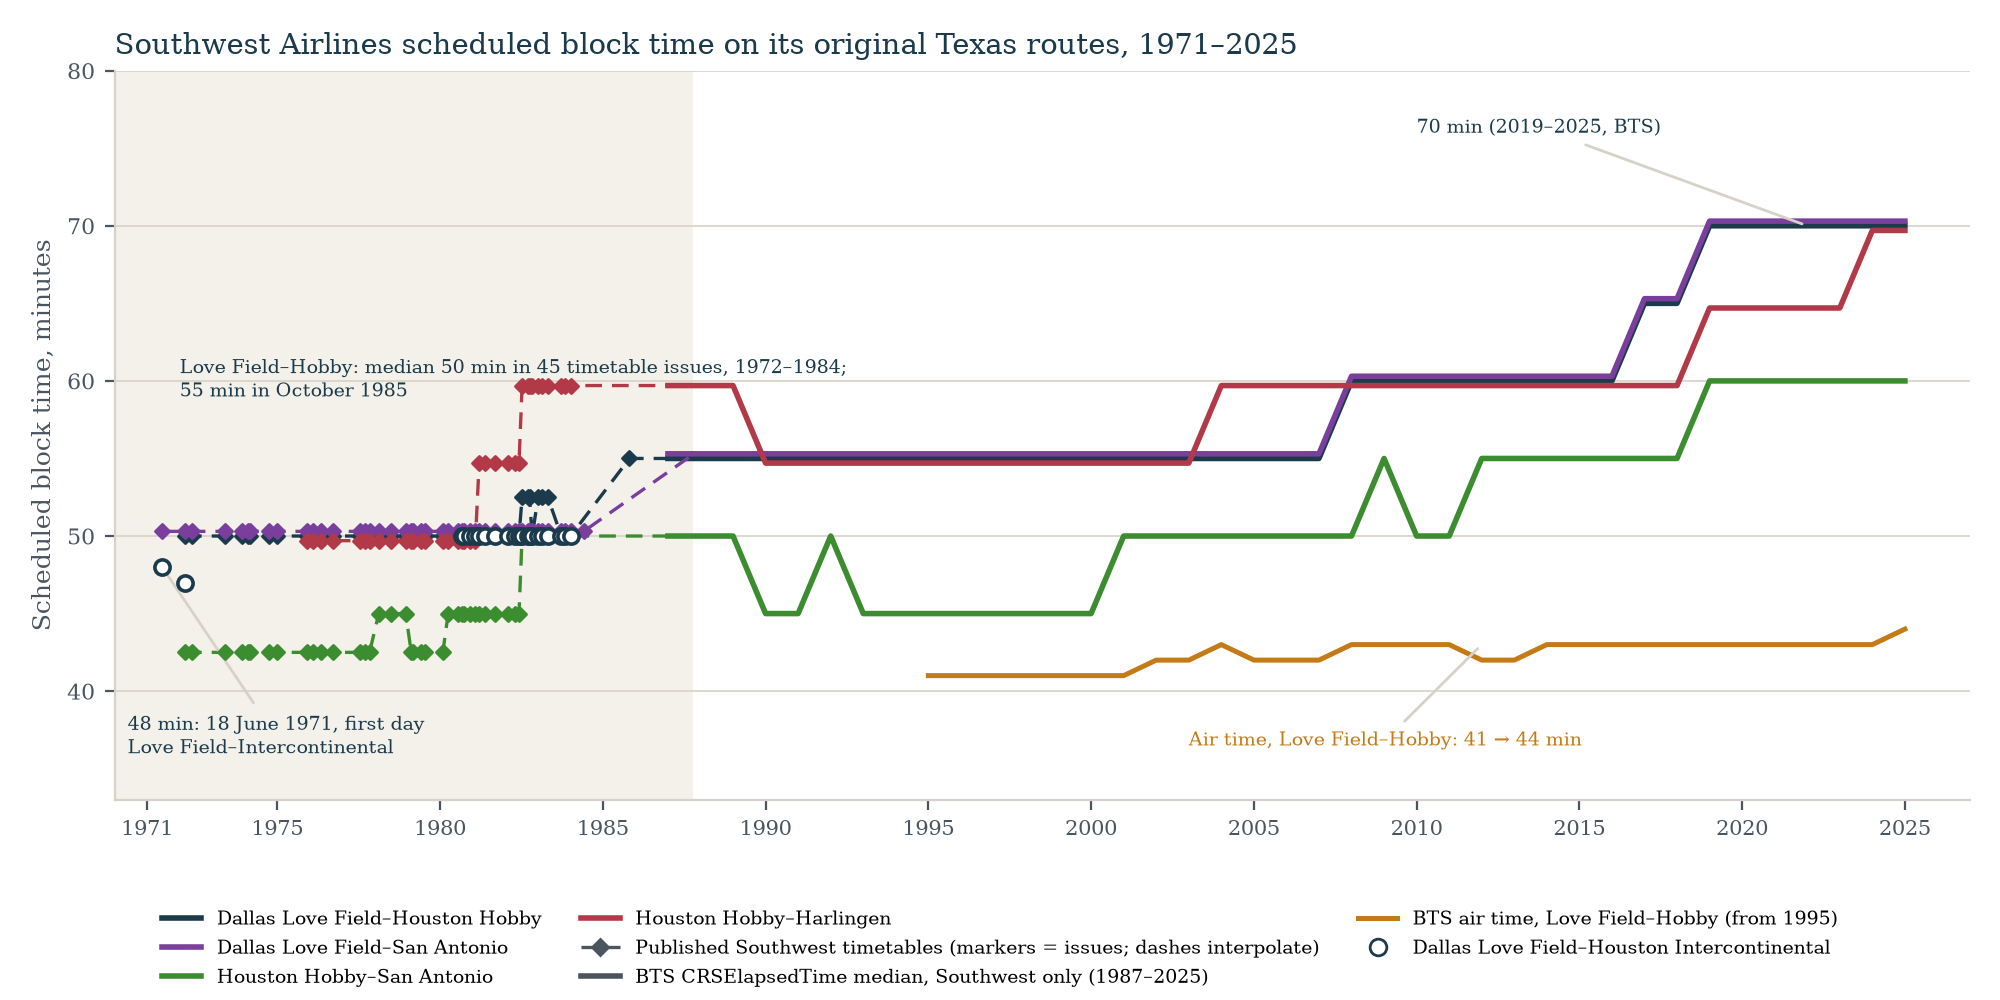
- Southwest Airlines scheduled Dallas Love Field–Houston Hobby at a median 50 minutes in all 45 timetables read from March 1972 to January 1984 and 55 minutes in October 1985; BTS shows 70 minutes in 2019–2025, while air time on the route moved only from 41 minutes (1995) to 44 (2025). Southwest’s first-day timetable, 18 June 1971, scheduled Love Field–Houston Intercontinental at 48 minutes.
- By network model, scheduled block grew under every form while air time stayed nearly flat. On continuing route–airline cells from 1995 to 2025, hub-and-spoke carriers added a median 13 minutes of scheduled block against +2 of air time; point-to-point (Southwest Airlines) +10 against +1; hybrid (Alaska Airlines) +14.25 against 0. Scheduled block grew more than air time on 94.1 percent, 98.6 percent, and 100 percent of those cells, respectively.
A companion report uses only AirTime on this same all-months panel and finds that air times have not lengthened: airtime.wheeltug.com.
What was measured
Scheduled block time is the BTS field CRSElapsedTime: the airline’s computer-reservation-system (CRS) scheduled time from gate departure to gate arrival. That CRS schedule is what the public BTS On-Time file carries. BTS Technical Directive No. 40 also has carriers report Official Airline Guide (OAG) schedule times; OAG is a separate commercial filing, is not in the public On-Time file, and is not used here. “Block time” is the airline-industry term for that gate-to-gate span; BTS does not use the phrase itself. Gate departure is when the pilot releases the parking brake after passengers have loaded and doors are closed (if the brake is not set, when the first passenger door closes); gate arrival is when the pilot sets the parking brake at the gate (if not set, when the first passenger door opens). ActualElapsedTime is the measured counterpart of the same span and is not used on this page.
Total Ground Time (TGT), as measured by GoScore: TGT is the time from touchdown on one flight to takeoff on the next. It is not derived by subtracting air time from scheduled block, and it is not analysed in this report.
Data provenance. Publisher: U.S. Department of Transportation, Bureau of Transportation Statistics (BTS), Reporting Carrier On-Time Performance (Airline On-Time Performance) via Transtats PREZIP (https://transtats.bts.gov/PREZIP/). Years 1987–1999 also use the Harvard Dataverse copy of the same BTS series (Data Expo 2009, doi:10.7910/DVN/HG7NV7). Fields used from the public On-Time file for this page: Year, Month, Reporting_Airline, Origin, Dest, Distance, CRSElapsedTime, and AirTime.
Coverage and filters. Every published month from October 1987 through August 2026 — 467 months, no month missing — 230,444,904 operated flights with a reported Distance of at least 50 miles that were not cancelled or diverted, of which 230,444,745 have a usable CRSElapsedTime. The scheduled-block analysis uses 225,836,516 flights with a usable CRSElapsedTime from October 1987 through December 2025 (1987 is October–December only; 2026 year-to-date is not included in that total). The constant set of 1,286 city-pairs flown in both 1995 and 2025 accounts for 179,398,417 of those flights. The ASPM cross-check is a separate, smaller sample and is not included in these BTS totals. Filters applied at ingest: Cancelled = 0, Diverted = 0, Distance missing or ≥ 50 miles, and AirTime values ≤ 0 or ≥ 800 dropped when AirTime is present (missing AirTime is kept so 1987–1994 scheduled-block rows survive). AirTime is blank in the BTS files from October 1987 through December 1994 (36,611,203 flights in those years). From 1995 through 2025 there are 189,225,468 such flights (189,223,380 with usable AirTime). The headline end year is 2025 (6,878,621 flights). 2026 is January–August year-to-date and is not used as an endpoint. 1987 is October–December only, the start of the BTS On-Time collection.
City-pairs are undirected (ATL–ORD pools both directions). A route or route–airline cell needs at least 30 flights in a year (or in that calendar month, for the seasonality view) to enter a comparison.
The same city-pairs, thirty years later
Holding the set of city-pairs fixed, scheduled block rises from 116.5 minutes in 1995 to 129 minutes in 2025. The same basket can be taken back to the start of the BTS file. In 1988, the first complete year, the median of route-level median scheduled blocks was 112 minutes (1,125 of the 1,286 pairs had at least 30 scheduled flights). By 1994 it was 116 minutes (1,242 pairs). The 1987 figure, 108 minutes, covers October–December only (1,070 pairs) and is not a full year. Air time on those same pairs, published only from 1995, moves from 96 to 97 minutes and stays inside a 96–100 minute range in every year it is available. Basket scheduled minutes per 1,000 miles (the median across pairs of each pair’s median scheduled block divided by its median distance, times 1,000) rose from 169.9 in 1995 to 188.6 in 2025, and stood at 167.6 in 1988. The matching air-time figure moved from 140.2 to 142.1.
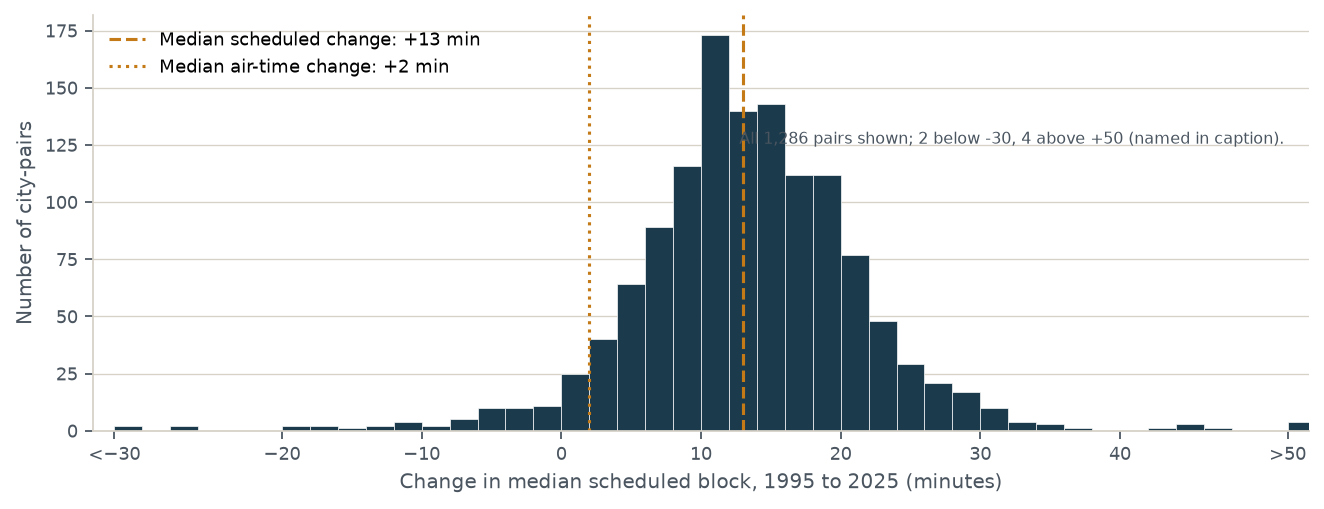
Of those 1,286 city-pairs, 1,221 (94.9 percent) added scheduled minutes, 53 shortened, and 12 were unchanged. 1,171 pairs (91.1 percent) lengthened by more than 3 minutes; only 76 (5.9 percent) stayed within 3 minutes of their 1995 scheduled block. The 10th-to-90th percentile range of the scheduled change is +4 to +22 minutes.
Seasonality: Block times grew in every season while air times stayed constant
| Month | City-pairs | Median change, scheduled | Median change, air | Scheduled grew more | Air flat within 3 min |
|---|---|---|---|---|---|
| January | 1,131 | +15 | +2 | 92.7% | 62.2% |
| February | 1,122 | +14.5 | +1.5 | 94.3% | 63.0% |
| March | 1,131 | +13 | +2 | 88.4% | 61.9% |
| April | 1,125 | +12.5 | +2 | 92.4% | 66.7% |
| May | 1,118 | +12 | +2 | 94.3% | 65.0% |
| June | 1,130 | +12 | +1.25 | 95.0% | 69.9% |
| July | 1,121 | +12 | +2 | 93.2% | 69.8% |
| August | 1,125 | +12 | +2 | 92.1% | 66.3% |
| September | 1,104 | +13 | +2 | 96.2% | 68.4% |
| October | 1,103 | +13 | +1 | 93.8% | 68.2% |
| November | 1,099 | +13 | +2 | 91.6% | 66.2% |
| December | 1,116 | +15 | +2 | 92.3% | 64.0% |
Matched-pair changes
| Unit | Window | Cells | Median change, scheduled | Median change, air | Share where scheduled grew more | Count |
|---|---|---|---|---|---|---|
| City-pairs | 1995–2025 | 1,286 | +13 | +2 | 95.3% | 1,225 of 1,286 |
| Route–airline | 1995–2025 | 738 | +13 | +2 | 95.4% | 704 of 738 |
| City-pairs | 2000–2025 | 1,361 | +9 | +1 | 88.8% | 1,208 of 1,361 |
| Route–airline | 2000–2025 | 870 | +10 | +1 | 87.6% | 762 of 870 |
| City-pairs | 2010–2025 | 1,827 | +5 | 0 | 78.1% | 1,426 of 1,827 |
| Route–airline | 2010–2025 | 1,710 | +5 | 0 | 77.0% | 1,316 of 1,710 |
The raw systemwide median scheduled block also rose, from 100 minutes in 1995 to 133 in 2025, while median air time rose from 79 to 100. Those figures track a longer typical flight (median distance 546 miles to 693 miles) as well as padding. The constant basket above is the fairer test, and it still shows scheduled block up 12.5 minutes while air time rises 1 minute. In 1987 (October–December only) the raw systemwide scheduled median was 81 minutes on a 418-mile typical hop; that mix is not comparable with 2025 without the route-level charts.
By distance band
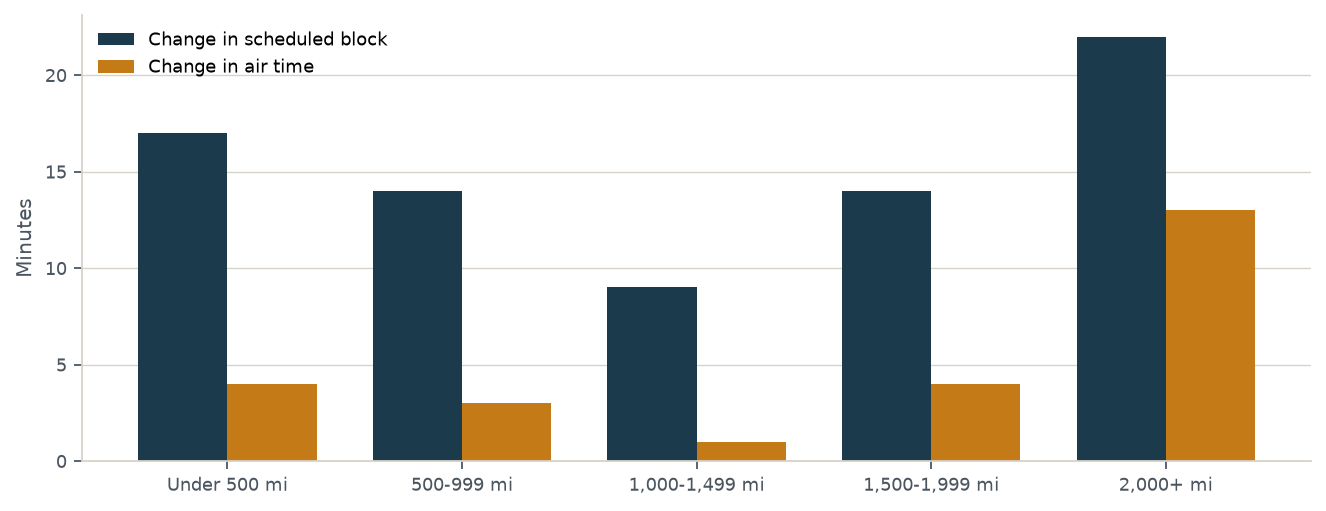
| Band | Scheduled 1995 | Scheduled 2025 | Change | Air 1995 | Air 2025 | Change in air |
|---|---|---|---|---|---|---|
| Under 500 mi | 68 | 85 | +17 | 50 | 54 | +4 |
| 500–999 mi | 121 | 135 | +14 | 100 | 103 | +3 |
| 1,000–1,499 mi | 179 | 188 | +9 | 154 | 155 | +1 |
| 1,500–1,999 mi | 236 | 250 | +14 | 211 | 215 | +4 |
| 2,000+ mi | 311 | 333 | +22 | 283 | 296 | +13 |
In the 1,000–1,499 mile band, air time moved from 154 to 155 minutes while scheduled block still rose 9 minutes.
By airline
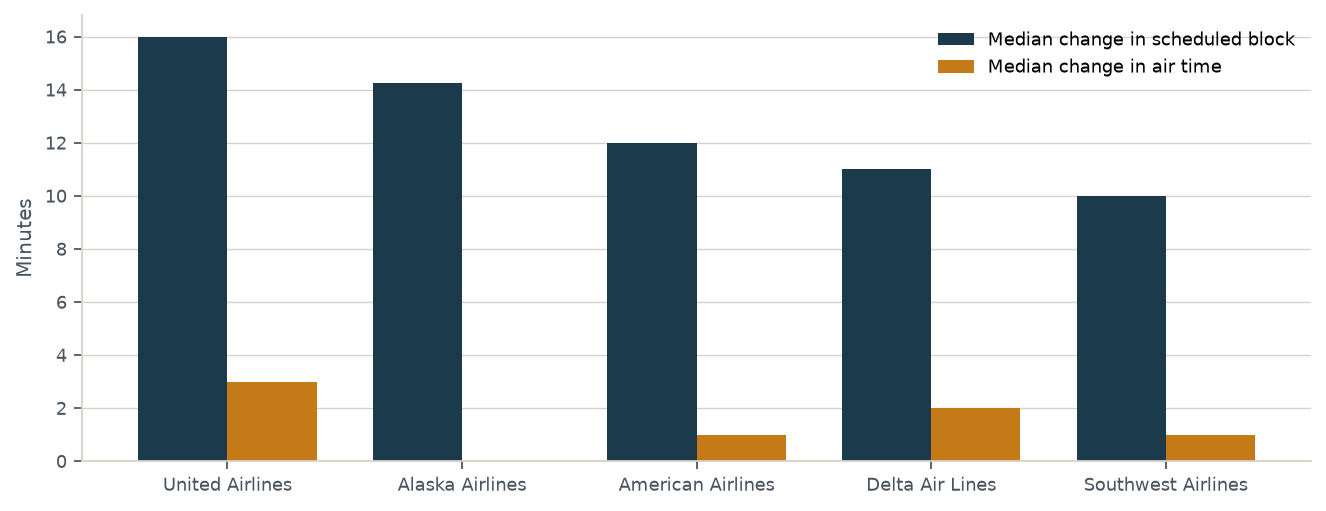
| Airline | Pairs | Change, scheduled | Change, air | Share scheduled grew more | Change, scheduled / 1,000 mi |
|---|---|---|---|---|---|
| United Airlines | 192 | +16 | +3 | 92.7% | +19.6 |
| Alaska Airlines | 54 | +14.25 | 0 | 100% | +22.5 |
| American Airlines | 167 | +12 | +1 | 95.2% | +11.4 |
| Delta Air Lines | 186 | +11 | +2 | 94.6% | +15.7 |
| Southwest Airlines | 139 | +10 | +1 | 98.6% | +24.5 |
A carrier’s raw systemwide median moves when its typical hop gets longer or shorter. These rows hold the city-pairs fixed instead. Carriers that do not appear in the 1995 file — including JetBlue Airways, Frontier Airlines, Hawaiian Airlines, and Spirit Airlines — have no 1995 baseline here.
Hub-and-spoke versus point-to-point
Classification rule. Hub-and-spoke (legacy): American Airlines, Delta Air Lines, United Airlines, and predecessors present in the panel (Continental Airlines, Northwest Airlines, US Airways, Trans World Airlines, America West Airlines). Point-to-point / low-cost: Southwest Airlines, JetBlue Airways, Spirit Airlines, Frontier Airlines, Allegiant Air, AirTran Airways, Virgin America, Sun Country Airlines, and Breeze Airways. Hybrid: Alaska Airlines and Hawaiian Airlines. Regionals that mainly feed hubs (SkyWest Airlines, Envoy Air, and similar) are not treated as a network-model contrast here.
A data check supports the split. In 2025, the three hub-and-spoke mainline carriers put 34 to 35 percent of their departures through their top-three origin airports. Southwest Airlines put 17.9 percent through its top three. Limits: from 1995 to 2025 the only continuing point-to-point route–airline cells are Southwest Airlines (139 cells). JetBlue Airways and Frontier Airlines enter the 2010–2025 window. Hybrid in the 30-year window is Alaska Airlines only.
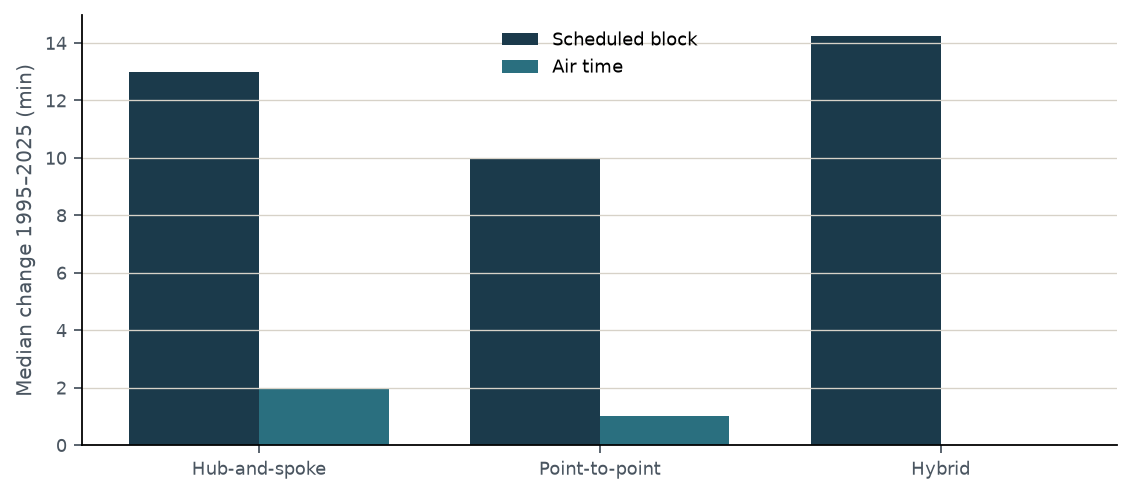
| Network model | Continuing cells | Carriers in window | Change, scheduled | Change, air | Share scheduled grew more |
|---|---|---|---|---|---|
| Hub-and-spoke (legacy) | 545 | American Airlines, Delta Air Lines, United Airlines | +13 | +2 | 94.1% |
| Point-to-point / low-cost | 139 | Southwest Airlines | +10 | +1 | 98.6% |
| Hybrid | 54 | Alaska Airlines | +14.25 | 0 | 100% |
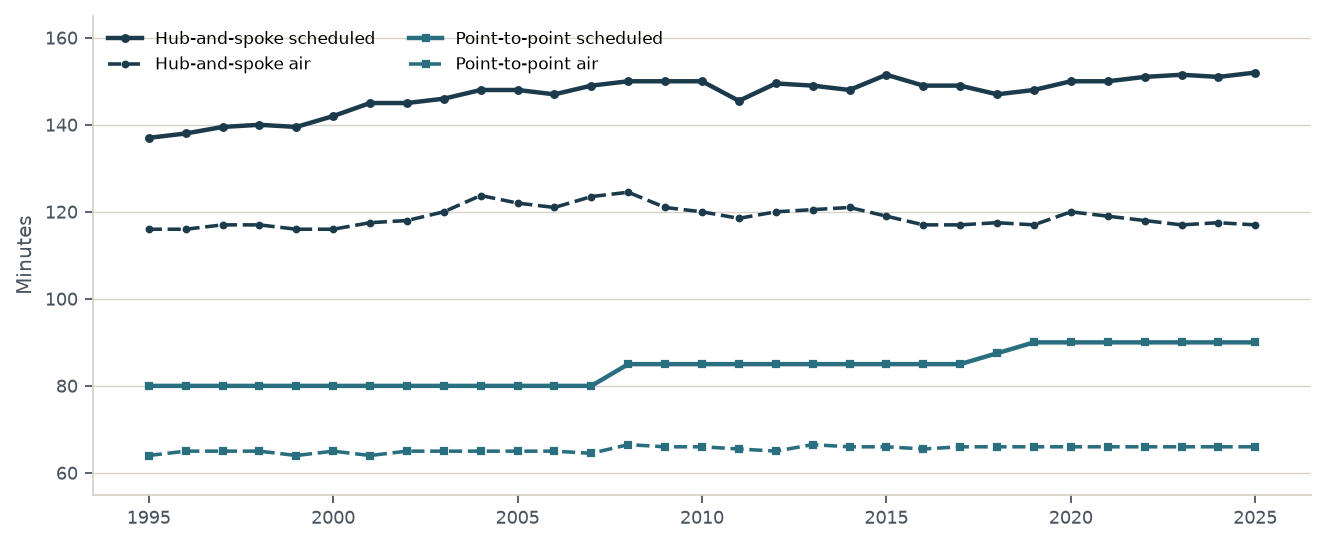
Holding the 1995-to-2025 continuing cells fixed as a basket, hub-and-spoke scheduled block rose from 137 to 152 minutes while air time moved from 116 to 117; point-to-point scheduled block rose from 80 to 90 while air time moved from 64 to 66; hybrid scheduled block rose from 112 to 126.5 while air time moved from 97.5 to 97.
From 2010 to 2025 the scheduled increase is smaller. Hub-and-spoke continuing cells show a median scheduled change of +2 minutes against 0 for air time (scheduled grew more on 55.0 percent of 635 cells) — pulled down by Delta Air Lines, whose 311 continuing cells had a median scheduled change of −3 minutes. Point-to-point cells (Southwest Airlines, JetBlue Airways, Frontier Airlines) show +5 scheduled against −1 air (scheduled grew more on 84.0 percent of 519 cells). Hybrid cells show +6 scheduled against 0 air.
Busiest continuing city-pairs
The 20 continuing city-pairs with the most combined 1995 and 2025 flights. Among the 50 busiest, scheduled block grew more than air time on every pair (median scheduled growth +14.2% against +2.6% for air time). Growth columns are percent change in the route-level median from 1995 to 2025. Source: BTS, all months.
| City-pair | Scheduled 1995 to 2025 | % change, scheduled | Air 1995 to 2025 | % change, air |
|---|---|---|---|---|
| LAX–SFO | 78 → 91 | +16.7% | 54 → 55 | +1.9% |
| LAS–LAX | 60 → 78 | +30.0% | 42 → 43 | +2.4% |
| LAX–PHX | 74 → 90 | +21.6% | 57 → 59 | +3.5% |
| LGA–ORD | 130 → 151 | +16.2% | 102 → 107 | +4.9% |
| MSP–ORD | 80 → 97 | +21.2% | 56 → 59 | +5.4% |
| LAS–PHX | 60 → 75 | +25.0% | 43 → 44 | +2.3% |
| JFK–LAX | 328 → 355 | +8.2% | 297 → 307 | +3.4% |
| DFW–IAH | 63 → 79 | +25.4% | 41 → 44 | +7.3% |
| LAX–ORD | 244 → 261 | +7.0% | 216 → 219 | +1.4% |
| SEA–SFO | 120 → 136 | +13.3% | 97 → 100 | +3.1% |
| DFW–ORD | 138 → 155 | +12.3% | 110 → 111 | +0.9% |
| BOS–ORD | 144 → 166 | +15.3% | 118 → 122 | +3.4% |
| EWR–ORD | 130 → 154 | +18.5% | 102 → 104 | +2.0% |
| LAX–OAK | 70 → 85 | +21.4% | 54 → 55 | +1.9% |
| BOS–DCA | 91 → 104 | +14.3% | 67 → 70 | +4.5% |
| DAL–HOU | 55 → 70 | +27.3% | 41 → 44 | +7.3% |
| DCA–ORD | 107 → 128 | +19.6% | 86 → 91 | +5.8% |
| ATL–DFW | 127 → 139 | +9.4% | 103 → 103 | +0.0% |
| SAN–SFO | 85 → 100 | +17.6% | 66 → 68 | +3.0% |
| LAX–SEA | 151 → 172 | +13.9% | 130 → 131 | +0.8% |
2010 to 2025
The last fifteen years still show scheduled block rising while air time does not, but the scheduled increase is smaller than the 1995-to-2025 rise. On 1,827 continuing city-pairs the median scheduled change is +5 minutes and the median air-time change is 0 minutes. Scheduled block grew more than air time on 1,426 of those pairs (78.1 percent).
That overall picture hides a real exception at Delta Air Lines. On Delta Air Lines’ 311 continuing route cells from 2010 to 2025, the median scheduled change was −3 minutes (air time 0), and scheduled block grew more than air time on only 89 of those 311 cells. Several of those schedules had already jumped between 1995 and 2010, so 2025 still sits above 1995 even where the last fifteen years gave a little back. Southwest Airlines (+5 versus −1), American Airlines (+8 versus 0), United Airlines (+6 versus +1), Alaska Airlines (+7 versus −1), and JetBlue Airways (+6 versus +1) continued to add scheduled minutes on their continuing pairs over 2010–2025.
Long run: published timetables (1965–1987) and BTS (1987–2025)
Pre-1987 figures are not BTS data. They are scheduled block times transcribed from scanned system timetables: departure and arrival printed in local time, converted to elapsed minutes with the civil-time offset between the two airports. Those offsets stay one, two, or three hours year-round because both ends observe daylight saving time together. Only flights marked NONSTOP (or Stops = 0 on the Continental Airlines edition) are included. Illegible or ambiguous times were skipped, not guessed. Dallas Love Field is coded DAL; Dallas/Fort Worth Regional, which opened in 1974, is coded DFW. The first hand transcription had 614 such flights from seven airlines; the final dataset holds 121,030 usable nonstop flights from 321 timetables of 22 airlines, 1965–1987.
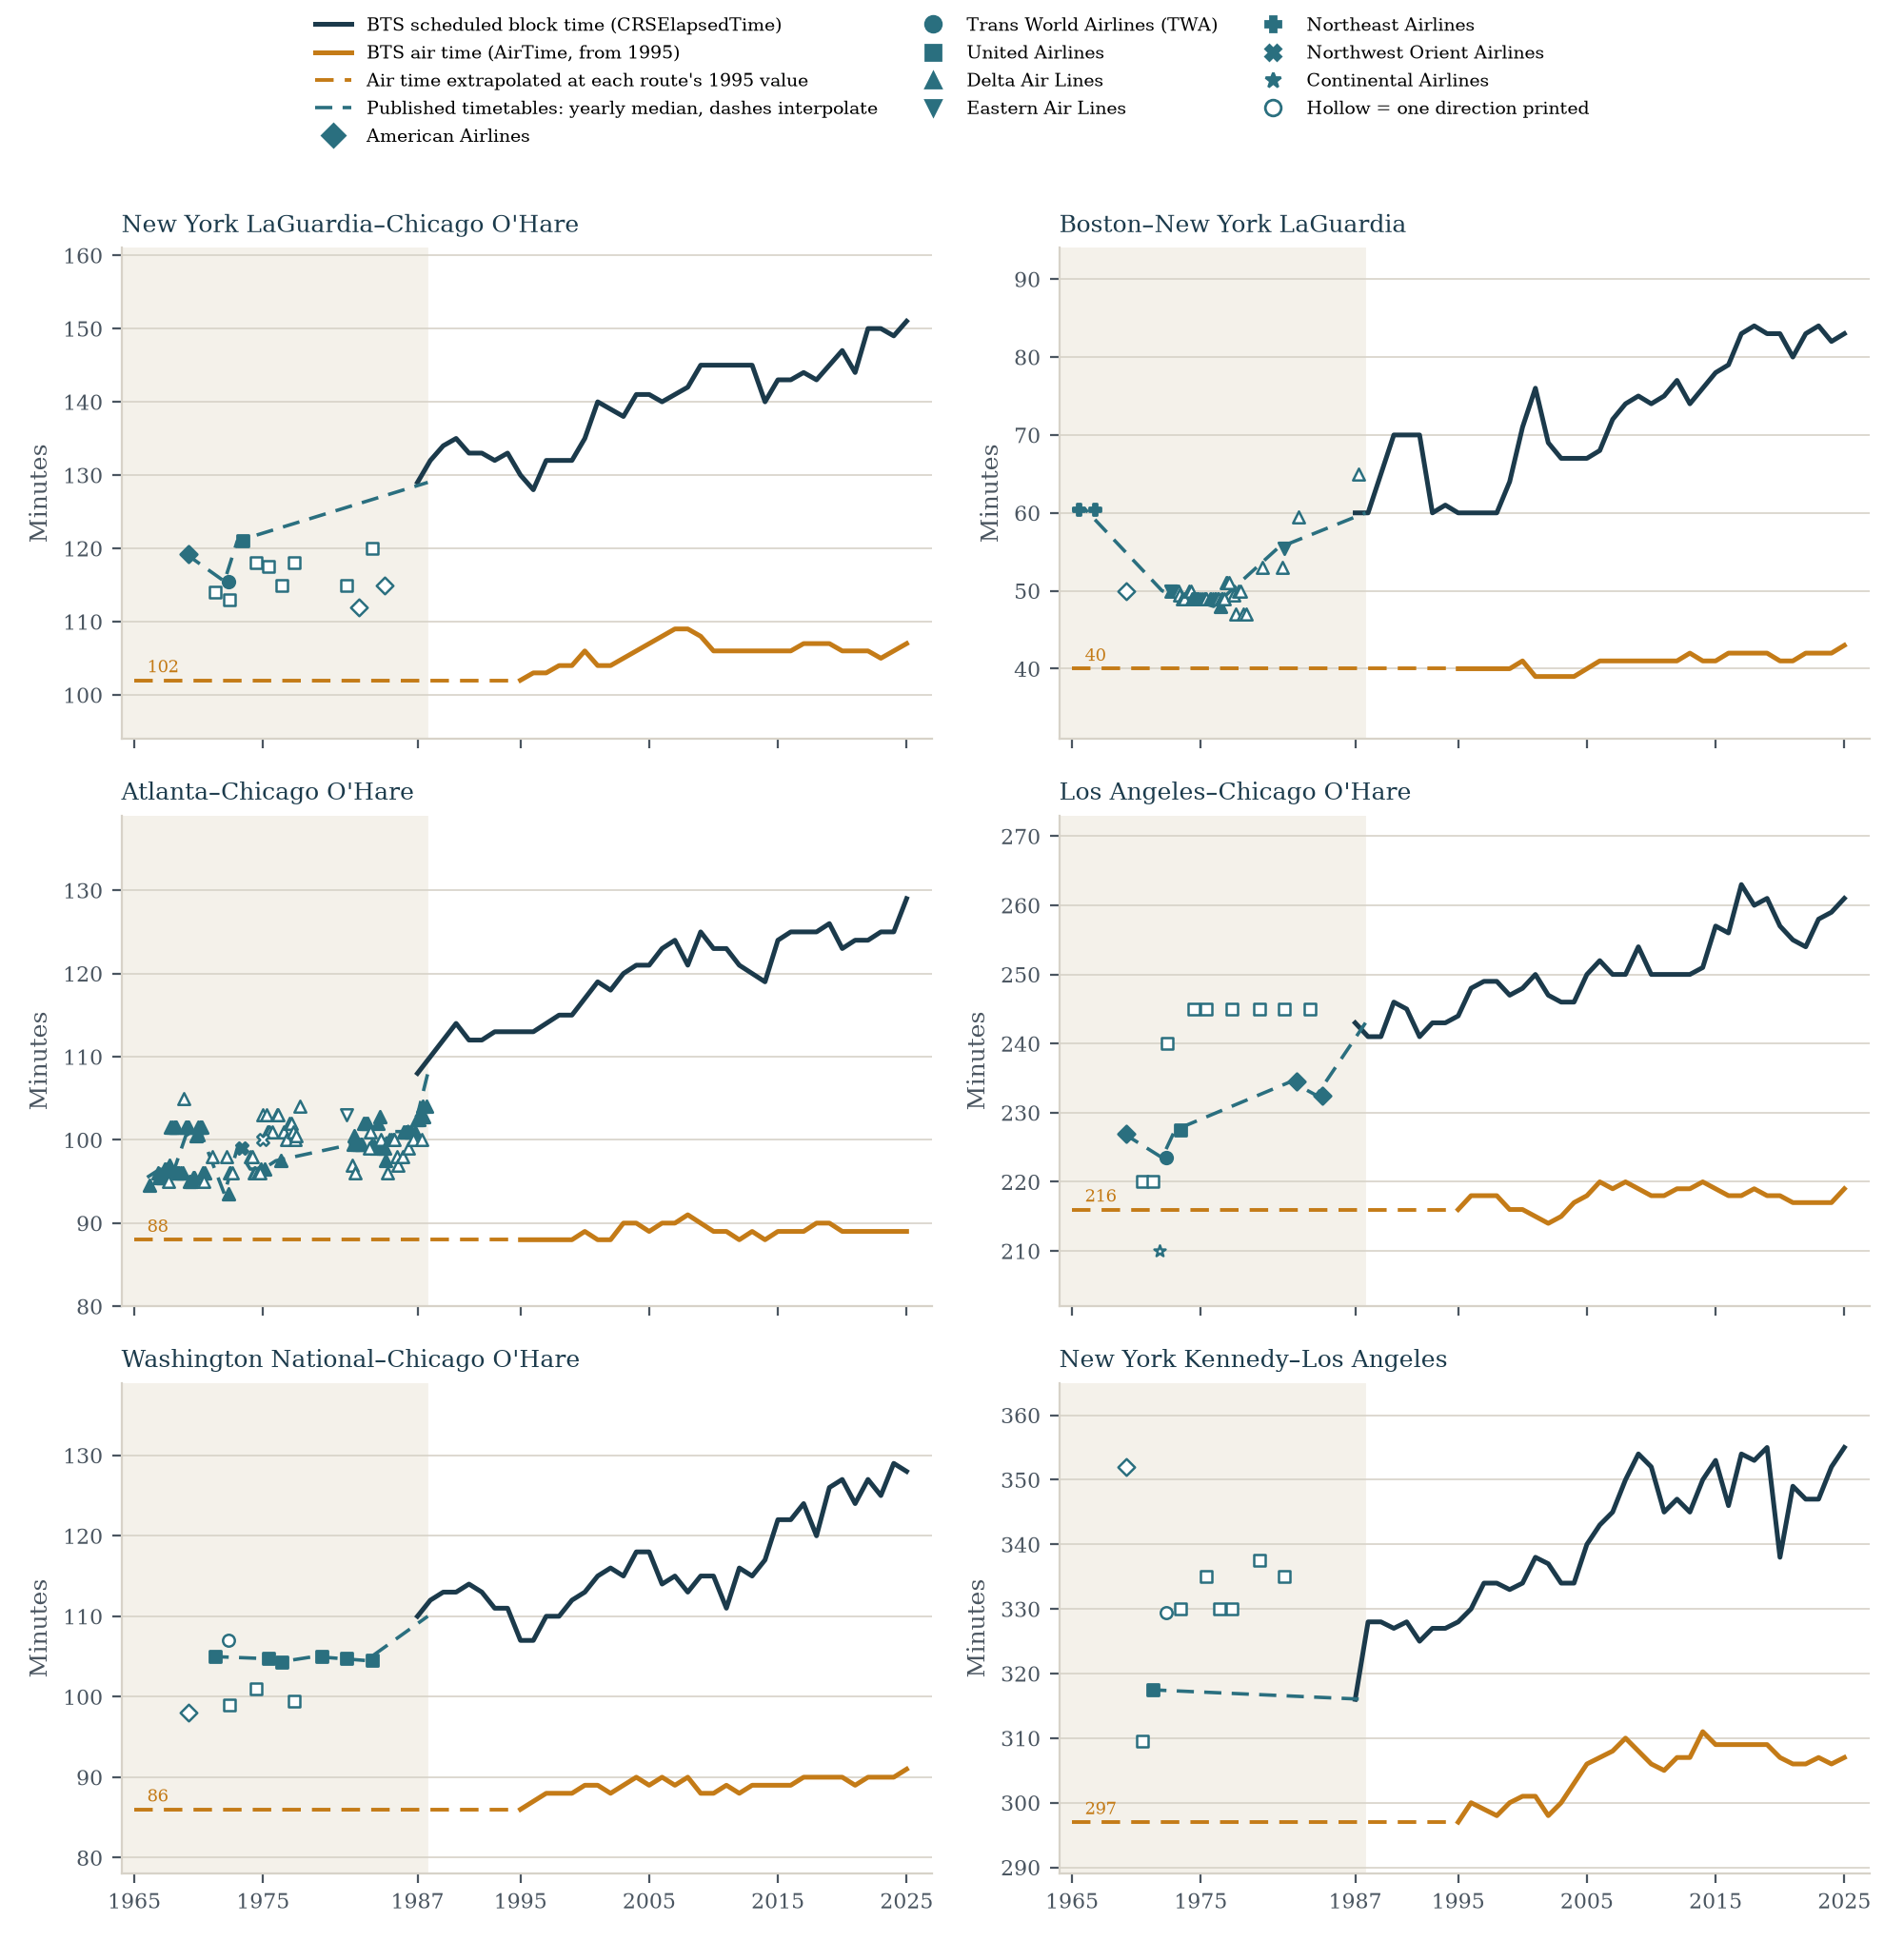
The long-run pattern is not a smooth climb on every route. JFK–LAX scheduled block was 352 minutes in the American Airlines 30 March 1969 timetable and 329.5 minutes in the Trans World Airlines 30 April 1972 timetable, then 328 minutes in BTS 1995 and 355 minutes in BTS 2025, while air time went from 297 to 307. ATL–ORD moved only from 97 minutes in the Delta Air Lines 1 June 1968 timetable to 104 minutes in the 15 December 1983 edition, then to 113 minutes in 1995 and 129 minutes in 2025, with air time 88 minutes in 1995 and 89 in 2025.
Southwest Airlines: the same Texas routes, 1971–2025
Southwest Airlines began flying on 18 June 1971. Its first-day timetable scheduled Dallas Love Field–Houston Intercontinental at 48 minutes gate to gate. After the move to Houston Hobby, all 45 timetables read from March 1972 to January 1984 scheduled Love Field–Hobby at a median 50 minutes (a few flights in the 1982–83 issues at 55), and the 27 October 1985 issue shows 55. BTS reports the same 55 minutes from 1987 through 2007, then 60 (2008–2016), 65 (2017–2018), and 70 minutes in every year from 2019 to 2025. Air time on the route moved only from 41 minutes in 1995 to 44 in 2025, shorter than the 48-minute block Southwest scheduled in 1971.
Is the trend just Delta? A robustness check
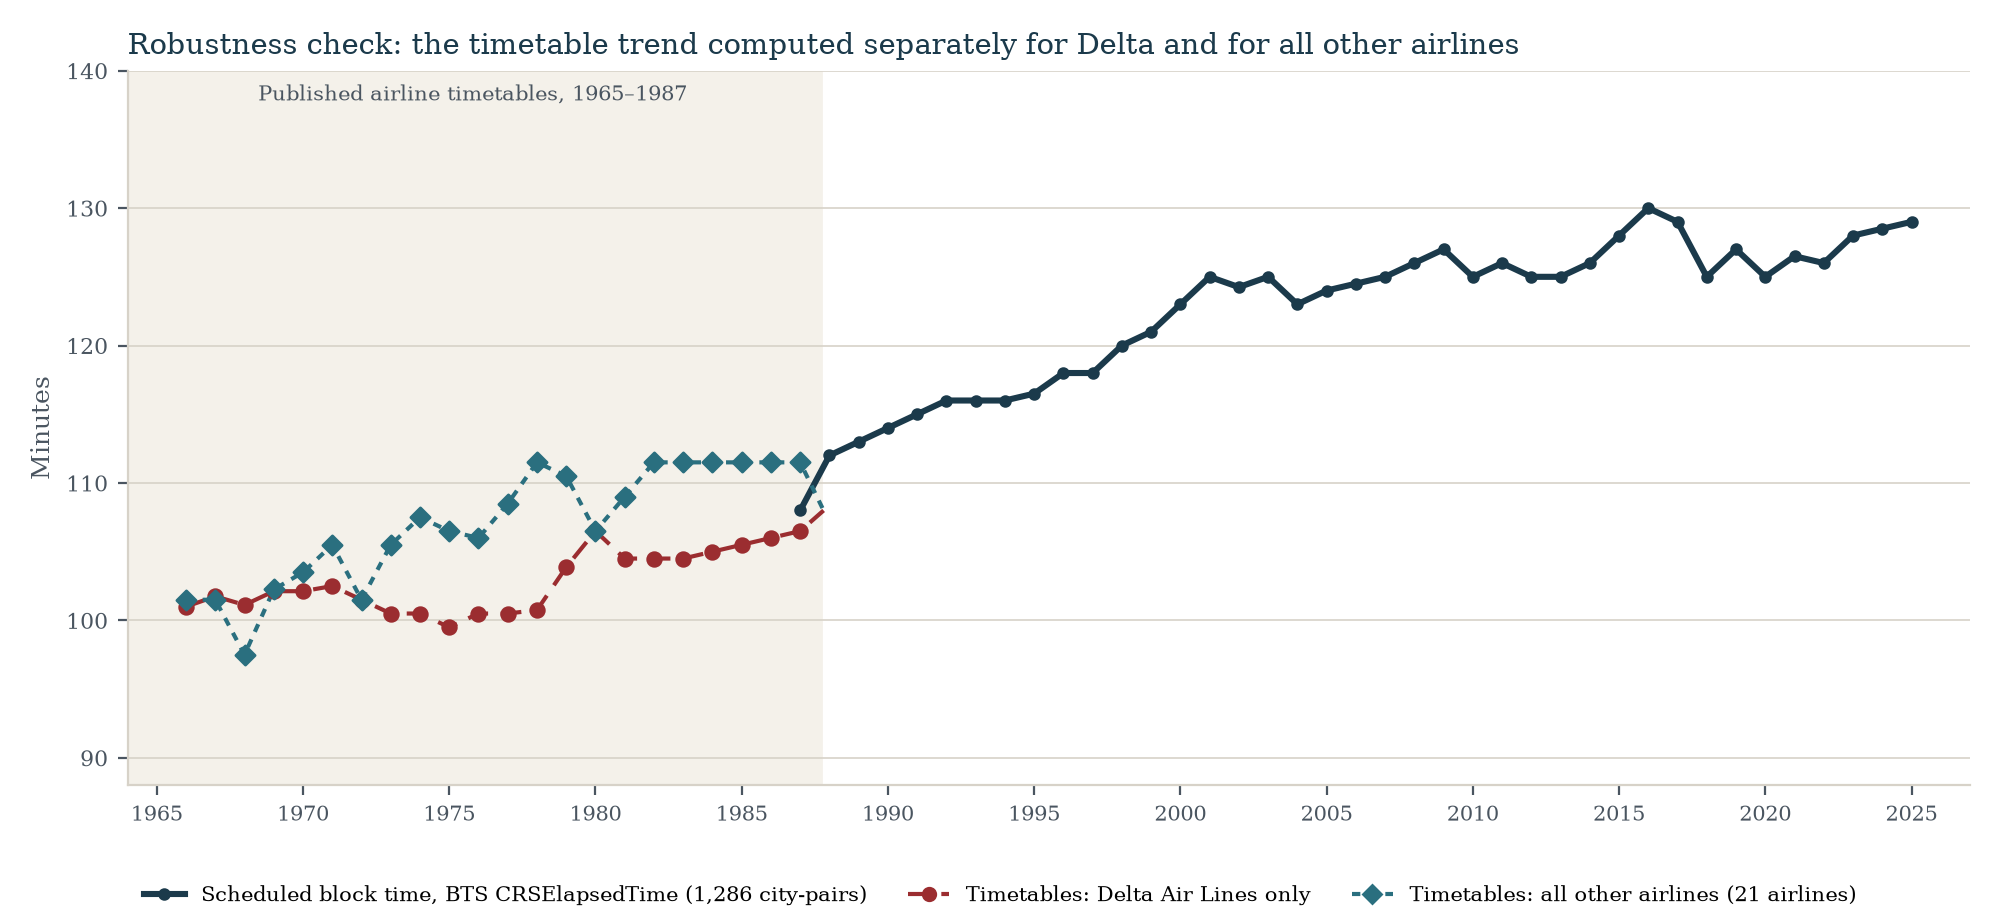
Delta Air Lines runs at 99.5–102.5 minutes from 1966 to 1978 and 104–106.5 minutes in 1979–1987. The other airlines track Delta closely in 1966–1972 and then run higher, at 105.5–111.5 minutes from 1973 on, a median 5.25 minutes above Delta. Both groups sit below the 1995 BTS level of 116.5 minutes in every year and both rise toward the BTS line from the late 1970s, so the conclusion does not depend on which airline’s timetables are read.
Why comparisons back to the early 1970s are fair
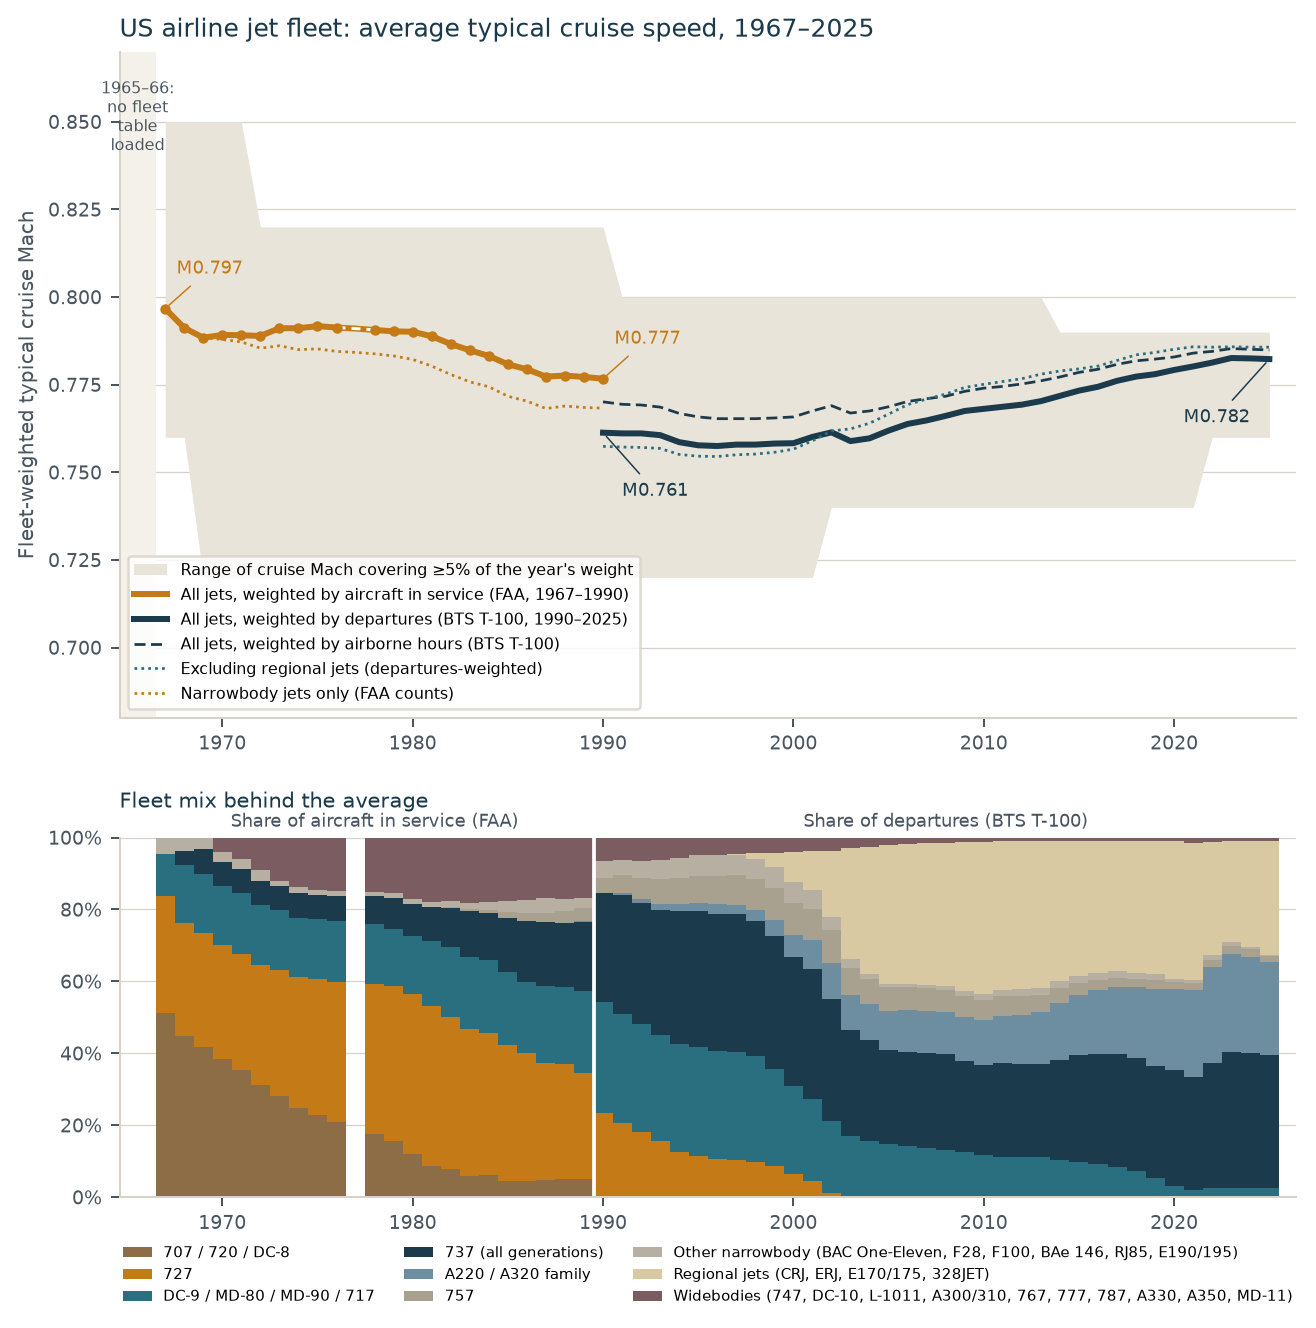
Since the advent of the Jet Age, fundamental airliner technology has not radically changed from the early 1970s to the present day. Electronics have become ubiquitous and aircraft have upgauged, but the swept-wing, turbofan-powered jet still cruises at much the same speed. Figure 10 weights each jet type’s typical cruise speed by how much of the US airline fleet it made up in each year. Counted by aircraft in service, the fleet average was Mach 0.797 (458 knots) in 1967, 0.790 in 1980 and 0.777 (448 knots) in 1990. Weighted by scheduled domestic departures, it was Mach 0.761 (435 knots) in 1990, bottomed at 0.758 in 1996 and reached 0.782 (453 knots) in 2025; weighted by airborne hours it was 0.770 in 1990 and 0.785 in 2025. Every measure stays between Mach 0.76 and 0.80 across 58 years, within about 2.5 percent of Mach 0.78. A city-pair flown in 1972 and in 2025 is therefore a fair test of how much time airlines schedule for the same trip.
Data provenance, published timetables. Dataset: 121,030 usable nonstop flights from 321 airline system timetables (22 airlines), effective dates 20 April 1965 to 15 September 1987, read from scans published by AirTimes, Airline Timetable Images, the Digital Library of Georgia (Delta Air Lines timetables, Delta Flight Museum collection), the Northwest Airlines History Center, Northwestern University Libraries (George M. Foster timetable collection), the Internet Archive, and Departed Flights; 5,553 flights were read by eye from page images. These are scheduled (published) times, not actual times and not BTS data. Delta Air Lines supplies 81 percent of the flights because its full run is machine-readable; the other 21 airlines supply 22,782 (18.8 percent). Final data: 12 November 2026, 6:20 PM Eastern Time; collection closed; 1,695 timetable issues examined or catalogued.
Cross-check: FAA ASPM versus BTS scheduled block time
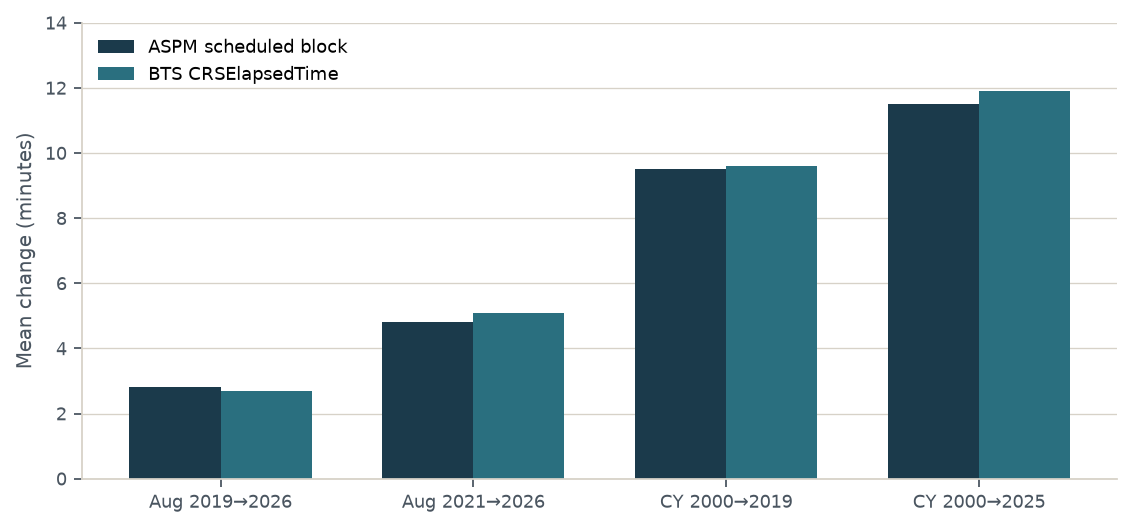
- Level agreement, January 2019 through August 2026 (3,680 direction-months on the 20 busiest 2025 BTS pairs, both directions): median ASPM minus BTS gap is 0 minutes; 89 percent of cells are within 2 minutes; 99 percent within 5 minutes.
- Growth agreement, August 2019 to August 2026: mean scheduled-block change is +2.8 minutes in ASPM and +2.7 in BTS. Calendar-year mean scheduled block on the 36 directions with solid 2000 coverage rose about +11.5 minutes (ASPM) / +11.9 (BTS) from 2000 to 2025.
Data provenance for this cross-check. ASPM: Federal Aviation Administration, Aviation System Performance Metrics, public City Pair Analysis Block Time Analysis (aspm.faa.gov), field Average Scheduled Block Time. BTS: field CRSElapsedTime, directional medians on the same pairs and months. What is not used: ASPM Average Actual Block Time, Average Block Delay, taxi, or any BTS ActualElapsedTime or taxi fields.
How to read these numbers
BTS Distance is the scheduled or great-circle mileage, not the miles actually flown. Minutes per 1,000 miles on this page is the ratio of a stored median time to a stored median distance (then multiplied by 1,000), or the median of that ratio across routes. It is not a new flight-level median, and it is labeled that way.
The file is US domestic reporting carriers only. The reporting set changed over time as carriers crossed the revenue threshold or reported voluntarily (more carriers appear in the file around 2003). Effective 1 January 2018 the mandatory threshold was lowered from 1 percent to 0.5 percent of domestic scheduled-service passenger revenue. Fleet mix is not separately held constant. Distance bands and the constant city-pair basket absorb stage-length mix; they do not isolate aircraft type. City-pairs are undirected, so each pair pools outbound and inbound flights.
Timetable block times are published schedules, not measured air time. They are the right comparison for BTS CRSElapsedTime and the wrong comparison for AirTime. No air-time figure is inferred for years before 1995. This report does not measure time on the ground as a residual. Showing scheduled block next to air time is the exhibit. GoScore Total Ground Time (touchdown on one flight to takeoff on the next) is not used here. There is no non-US coverage.
Sources available but not incorporated
Research for this report closed on 12 November 2026. Additional timetables are available online or were already downloaded, but were not transcribed, or were only partly transcribed. This additional transcription was not carried out because it was judged that no relevant data was missing that would alter or affect the report’s analysis or conclusions. The timetable trend is already consistent between Delta Air Lines and the other 21 airlines, robust to screening choices (only 1968 moves, by 0.38 minutes), and Delta Air Lines’ own 1987 timetables match BTS on 403 route directions. The PDF edition links each issue to its scan.
Partly transcribed
- United Airlines, 1 Jul 1974, printed pages 36 to about 112 (pages 3–35 are used): airtimes.com
- Trans World Airlines (TWA), 1 Jun 1985, full system timetable (one flight entered so far): airtimes.com
- Trans World Airlines (TWA), 1 Feb 1970, rotated scan (three flights entered so far): Northwestern University Libraries
The PDF lists the downloaded-but-untranscribed issues from AirTimes, Northwestern University Libraries (George M. Foster collection), the Northwest Airlines History Center, the Internet Archive, and Airline Timetable Images, plus issues available online but not downloaded.
Sources
- U.S. Bureau of Transportation Statistics, Reporting Carrier On-Time Performance PREZIP: https://transtats.bts.gov/PREZIP/.
- BTS field definitions (CRSElapsedTime, AirTime): https://www.transtats.bts.gov/Fields.asp?gnoyr_VQ=FGJ.
- BTS Technical Directive No. 40, Reporting of Time: https://www.bts.gov/explore-topics-and-geography/modes/aviation/number-40-technical-directive-reporting-time.
- BTS Transtats terms (Airline On-Time Performance): https://www.transtats.bts.gov/DatabaseInfo.asp?QO_VQ=EFD.
- Harvard Dataverse, Data Expo 2009 (BTS 1987–1999), doi:10.7910/DVN/HG7NV7: https://doi.org/10.7910/DVN/HG7NV7.
- BTS lists of reporting air carriers (threshold change effective 1 January 2018): https://www.bts.gov/topics/airlines-and-airports/lists-reporting-air-carriers-and-reportable-airports-time-performance.
- FAA ASPM City Pair Analysis (Block Time Analysis): https://www.aspm.faa.gov/apm/sys/AnalysisCP.asp.
- ASPM Flight Schedule Data System (FSDS): https://aspmhelp.faa.gov/index/Flight_Schedule_Data_System_(FSDS).html.
- EUROCONTROL Aircraft Performance Database: https://learningzone.eurocontrol.int/ilp/customs/ATCPFDB/.
- FAA Statistical Handbook of Aviation, CY1976 Table 5-8, CY1987 Table 5.2, CY1989 Table 5.2, CY1990 Table 5.2 (Internet Archive DTIC_ADA054801, DTIC_ADA200917, DTIC_ADA232670, DTIC_ADA249128): https://archive.org/details/DTIC_ADA054801.
- BTS T-100 Domestic Segment (U.S. Carriers), 1990–2025: https://www.transtats.bts.gov/DL_SelectFields.aspx?gnoyr_VQ=FIM.
- FAA, New Connecting Hub Airports Study (1990): https://rosap.ntl.bts.gov/view/dot/12648.
- Deshpande, Analysis of airline schedule padding on U.S. domestic routes (MIT, 2011): https://hdl.handle.net/1721.1/66870.
- Cook and Goodwin, Airline Networks: Hub-and-Spoke vs Point-to-Point (JAAER, 2008): https://doi.org/10.15394/jaaer.2008.1443.
- AirTimes airline timetable collection (curated by P. Sloan): https://www.airtimes.com/cgat/cgat.htm.
- Airline Timetable Images (Björn Larsson and David Zekria): https://www.timetableimages.com/.
- Digital Library of Georgia: Delta Air Lines System Timetables 1934–2004 (Delta Flight Museum): https://dlg.usg.edu/collection/delta_dal-tt.
- Northwest Airlines History Center timetables: https://northwestairlineshistory.org/timetables/.
- Northwestern University Libraries digital collections (George M. Foster timetables): https://dc.library.northwestern.edu/.
- Internet Archive airline timetables: https://archive.org/search?query=airline+timetable.
- Departed Flights timetables: https://www.departedflights.com/.
- Companion report, US air times have not lengthened: https://airtime.wheeltug.com.
- GoScore.
Prepared by GoScore / WheelTug.
Figures computed from the files named above; none are invented. Every timetable flight is stored with its airline, effective date, page, and a link to its scan. The 321 published airline timetables that supplied the 121,030 usable nonstop flights are listed, each with a link to its scan, in the PDF edition.